In a SQLServer datawarehouse you might have a lot of jobs scheduled through SQL Server Agent. There is little out of the box visibility on the status of those jobs, parallel executions, duration of the different steps, etc… In this article I’ll describe how I used Power BI to provide this visibility on SQL Server Agent jobs.
Scenario
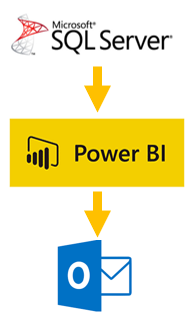
The goal is to create a PowerBI report that visualizes the status of your SQLAgent jobs. The report will use DirectQuery to get the most complete picture. Adding a subscription to the report will allow me to have a summary of the nightly jobs in my mailbox every the morning, providing priceless peace of mind.
I’ll also add in the minimum, maximium and average time the step normally takes, as well as the error message of a failed step, so you can immediately display it in a tooltip.
Design
History view
Since I will use a Common Table Expression, the query can’t be stored in PowerBI. To overcome this, create the below view in the msdb database. It will also allow you to do additional filtering, without redeploying the report.
CREATE VIEW [dbo].[job_step_history_analysis]
AS
WITH job_history
AS (
   SELECT SJ.[name] AS [Job],
          SJH.step_name [Step],
          SJH.step_id [Step Order],
          C.[name] AS [Category],
          msdb.dbo.agent_datetime(SJH.run_date, SJH.run_time) AS [Start Time],
          CASE
              WHEN SJH.run_status = 0 THEN
                  'Failed'
              WHEN SJH.run_status = 1 THEN
                  'Succeeded'
              WHEN SJH.run_status = 2 THEN
                  'Retry'
              WHEN SJH.run_status = 3 THEN
                  'Cancelled'
              ELSE
                  'Unknown'
          END [Job Outcome],
          SJH.run_duration % 100 + -- seconds
          (SJH.run_duration / 100) % 100 * 60 + -- minutes to seconds
          (SJH.run_duration / 10000) % 100 * 60 * 60 -- hours to seconds
          [Duration In Seconds],
          IIF(SJH.run_status = 0, SJH.[message], '') [Error Message]
   FROM sysjobhistory SJH
       JOIN sysjobs SJ
           ON SJH.job_id = SJ.job_id
       INNER JOIN syscategories C
           ON SJ.category_id = C.category_id
   WHERE SJ.enabled = 1
         AND step_id <> 0
         AND SJH.run_duration > 0)
SELECT [Category],
       [Job],
       [Step],
       [Step Order],
       [Start Time],
       [Job Outcome],
       [Duration In Seconds],
       MIN(job_history.[Duration In Seconds]) OVER (PARTITION BY Job, Step) AS [Min Duration In Seconds],
       MAX(job_history.[Duration In Seconds]) OVER (PARTITION BY Job, Step) AS [Max Duration In Seconds],
       AVG(job_history.[Duration In Seconds]) OVER (PARTITION BY Job, Step) AS [Average Duration In Seconds],
       ((1.0 * [Duration In Seconds] / (AVG(job_history.[Duration In Seconds]) OVER (PARTITION BY Job, Step))) - 1) [Pct Increase],
       [Error Message]
FROM job_history;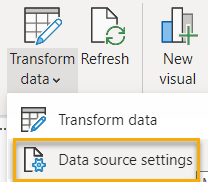
PowerBI report
I setup a basic template for the PowerBI report, which you can download below.
To replace the connection to the database, go to Transform, Data Source Settings.
Download the report here : SQLAgent monitor
Datasource Query
The DirectQuery datasource contains following query, which does some conversions from seconds to “x Hours y Minutes z Seconds” for more clean display in the tooltip.
SELECT
[Category], [Job], [Step], [Step Order], [Start Time], [Job Outcome], [Duration In Seconds],
[Min Duration In Seconds],
[Max Duration In Seconds],
[Average Duration In Seconds],
IIF([Min Duration In Seconds]/60/60>0, CONVERT(VARCHAR, [Min Duration In Seconds]/60/60) + ' Hours ','') +
IIF([Min Duration In Seconds]/60> 0, CONVERT(VARCHAR, [Min Duration In Seconds]%3600/60) + ' Minutes ','') +
CONVERT(VARCHAR, [Min Duration In Seconds]%60) + ' Seconds' [Min Duration],
IIF([Max Duration In Seconds]/60/60>0, CONVERT(VARCHAR, [Max Duration In Seconds]/60/60) + ' Hours ','') +
IIF([Max Duration In Seconds]/60> 0, CONVERT(VARCHAR, [Max Duration In Seconds]%3600/60) + ' Minutes ','') +
CONVERT(VARCHAR, [Max Duration In Seconds]%60) + ' Seconds' [Max Duration],
IIF([Average Duration In Seconds]/60/60>0, CONVERT(VARCHAR, [Average Duration In Seconds]/60/60) + ' Hours ','') +
IIF([Average Duration In Seconds]/60> 0, CONVERT(VARCHAR, [Average Duration In Seconds]%3600/60) + ' Minutes ','') +
CONVERT(VARCHAR, [Average Duration In Seconds]%60) + ' Seconds' [Average Duration],
[Pct Increase], [Error Message]
FROM job_step_history_analysis
Report visual
The visual used for this data is called Gantt. You’ll have to add it from the AppSource by clicking the ellipsis and “Get More Visuals”. Search for Gantt and you’ll find the below.

Once added, place it on the page and configure as follows:
- Job Outcome in the Legend field. This will allow you to see different states of the steps in different colors.
- Step in the Task field. This splits a Job in its separate steps, and show them on a timeline.
- Job in the Parent field. This groups the steps together for the same job
- Start Time in Start Date.
- Duration in Seconds in Duration field.
- Finally, for the Tooltips, configure Average Duration, Max Duration and Error Message as the three fields.
Filter
Since we’re normally only interested in the last day of job runs, provide a slicer for the Start Time field. By default you can set it to filter Last 1 day.
Another useful slicer is a dropdown for Job, so you can just look at certain jobs, in case you have a busy schedule.
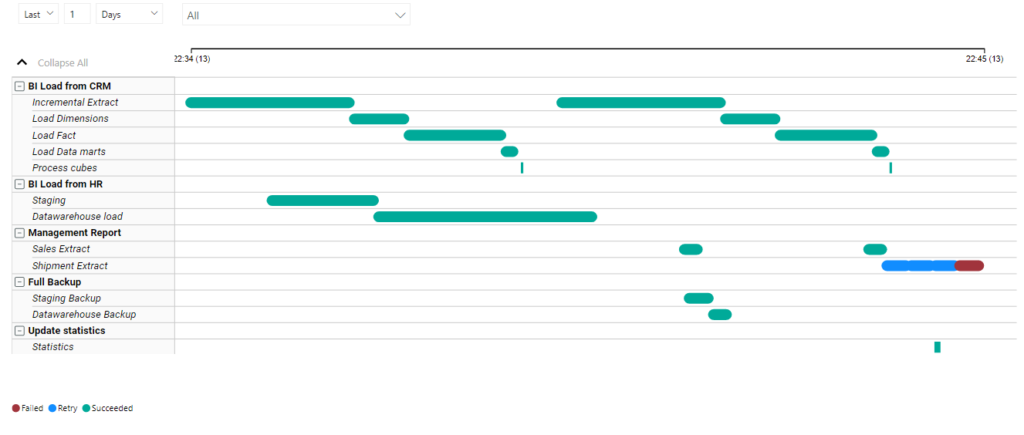
The result should look something like this, which you can further optimize and configure for your needs.
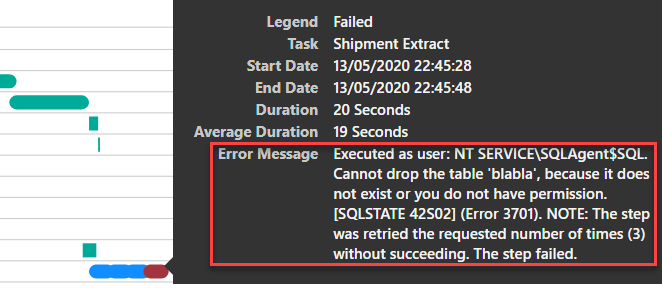
You’ll notice that when hovering over a job step, the tooltip should more information. In the case of a step in error, you’ll see the error message, saving quite some time when troubleshooting.
Subscription
To get a state of the job history in your mailbox, simply click “Subscribe” in the PowerBI published report.
Conclusion
As you see, using a Gantt chart component it’s easy to quickly get a more complete understanding of the SQL Agent job activity.
Read More
In case you’re interested in Business Intelligence, feel free to read other articles I made like https://www.mattiasdesmet.be/2020/04/13/mastering-new-data/
David L Plaut
I get an error when trying to open the pbix file. Could it be an older format? Can you update it? Looks useful.
Davy Van Goethem
Hey Mattias,
How do you get the Gantt chart to accept duration in seconds?
As far as I can see it only accepts duration in days.
mattias
Hi David,
I’ve updated the PBIX file to the latest format. Sorry for the delay, but the notification went in my spam.
mattias
Hi Davy,
I created a measure that holds the duration in seconds. I use it on the Duration field of the visual Gantt v2.2.3.
On the Visual tab, under General, you’ll find Duration Unit, which you can set to Seconds.