With its simple Active Sessions table, Navision doesn’t provide an option out-of-the-box to track usage information. I will describe a mechanism that will allow you to understand what the maximum users sessions were in the past x days, how many on average, and plot the historical data. You can also see what type of clients your user favor. All of this information allows you to optimize the amount of licenses and infrastructure required. And it’s a good opportunity to dive into DAX‘s MAXX and AVERAGEX functions.
Setup
Create a History table in the Navision database using below statement
CREATE TABLE [dbo].[Active Session History](
	[Server Computer Name] [nvarchar](250) NOT NULL,
	[User ID] [nvarchar](132) NOT NULL,
	[Client Type] [int] NOT NULL,
	[Client Computer Name] [nvarchar](250) NOT NULL,
	[Login Datetime] [datetime] NOT NULL,
	[Database Name] [nvarchar](250) NOT NULL
) ON [PRIMARY]
GO
Create the below After Insert trigger, which will log a record in the history table every time a new session is opened (user connects to Navision)
CREATE TRIGGER [dbo].[TAI_ActiveSessionHistory]   ON  [dbo].[Active Session]
   AFTER INSERT
AS
BEGIN
	INSERT into dbo.[Active Session History] (
        [Server Computer Name]
      , [User ID]
      , [Client Type]
      , [Client Computer Name]
      , [Login Datetime]
      , [Database Name])
	SELECT
	[Server Computer Name]
      , [User ID]
      , [Client Type]
      , [Client Computer Name]
      , [Login Datetime]
      , [Database Name] from inserted;
END
GO

ALTER TABLE [dbo].[Active Session] ENABLE TRIGGER [TAI_ActiveSessionHistory]
GO
With this in place, the history table populates with usage data, which we’ll analyse using PowerBI. Note: make sure you add a purging logic, so this table doesn’t keep growing.
Analysis in PowerBI
Model
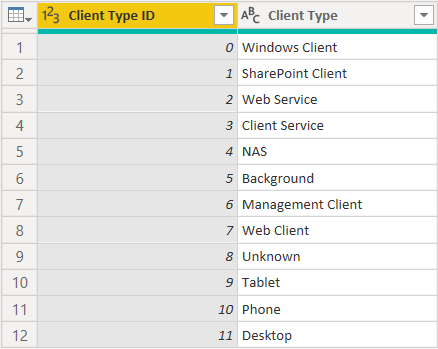
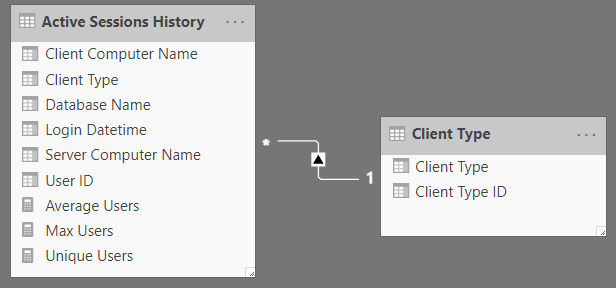
Create one query that contains the Active Sessions History table. Add another mapping table for the Client Type, so we can show a nice description for the Client Type ID.
Link Client Type ID in the Model, so you can filter the report on Client Types.
DAX Calculations
To determine the Maximum unique session count over the past days, create following new measure in the Active Sessions History query
Max Users = MAXX (
    SUMMARIZE (
        'Active Sessions History',
        'Active Sessions History'[Login Datetime],'Active Sessions History'[Database Name], "Unique", DISTINCTCOUNT ('Active Sessions History'[User ID] )
    ),
    [Unique]
)
MAXX takes a table as first argument. Here, we’ll generate a summary table using SUMMARIZE containing the distinct count of UserID , grouped by Login DateTime (and Database Name – you can expand this solution for multiple Navision databases easily). Of this we’ll take the Maximum value.
The same is implemented to obtain the Average using AVERAGEX and SUMMARIZE:
Average Users = AVERAGEX (
SUMMARIZE (
'Active Sessions History',
'Active Sessions History'[Login Datetime],'Active Sessions History'[Database Name], "Unique", DISTINCTCOUNT ('Active Sessions History'[User ID] )
),
[Unique]
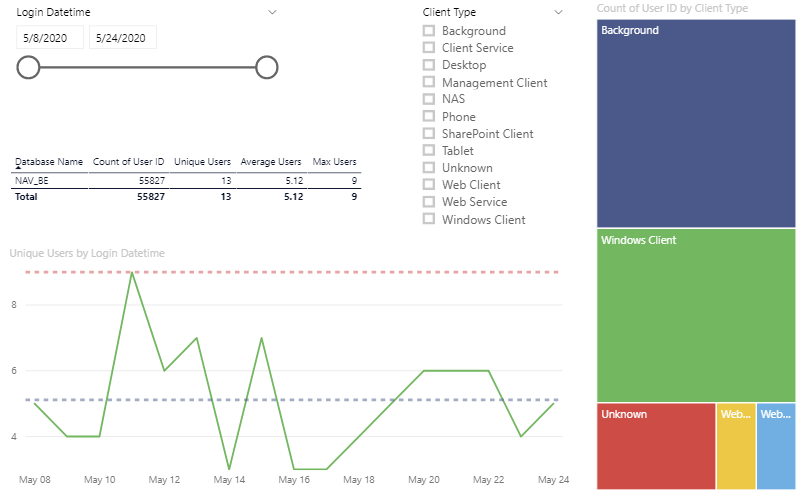
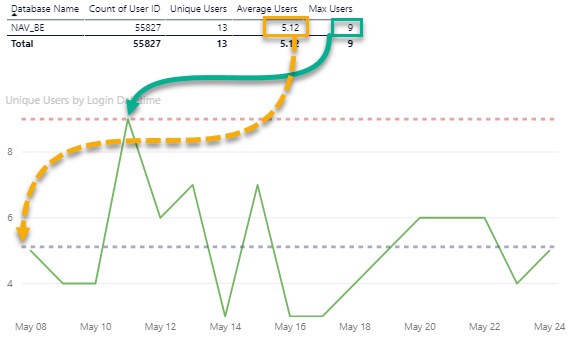
)These measures can now be used to show the maximum and average signed in users over the past days (you can set this up as a filter). When plotting the data by day, and adding maximum and average trend lines, you can verify the calculation works.
Download the report here: Navision Usage Report
Read More
If you’re interested in Navision and Azure, make sure to read my post on how to use a Azure SQL DB as backend for Navision.